
Light Mode

Bullish and bearish MACD crossovers on every stock, the moment they print.
Twenty MACD alerts: signal-line and zero-line crosses, up and down, on 5, 10, 15, 30 and 60-minute charts.
Free account, just an email. No card. 15-minute delayed data.

Named to the Inc. 5000 list of America’s fastest-growing private companies six years in a row (2017–2022).

Investopedia: Best Short Term Stock Screener, 2024
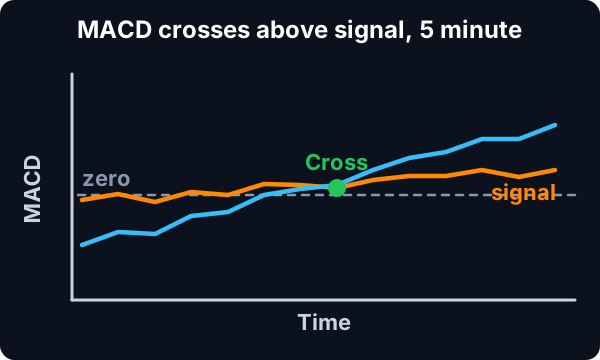
Pick the cross and the chart. Trade Ideas watches every US stock and streams the alert when it happens.
Streaming Alerts (Scanner) run in TI Pro, our desktop app for Windows (on a Mac, through Parallels).
MACD is the gap between two moving averages of price. The signal line is an average of MACD itself. When MACD crosses above the signal line, momentum is turning up; below, it is turning down. When MACD crosses zero, the faster average has crossed the slower one.
A MACD scanner tells you which stocks just made one of those crosses, without opening every chart.
| Alert | What it does |
|---|---|
| 5 Minute MACD Crossed Above Signal (MDAS5) | MACD crosses above signal, 5 minute. Also MDAS10, MDAS15, MDAS30, MDAS60. |
| 5 Minute MACD Crossed Below Signal (MDBS5) | MACD crosses below signal, 5 minute. Also 10, 15, 30, 60. |
| 5 Minute MACD Crossed Above Zero (MDAZ5) | MACD crosses above zero, 5 minute. Also 10, 15, 30, 60. |
| 5 Minute MACD Crossed Below Zero (MDBZ5) | MACD crosses below zero, 5 minute. Also 10, 15, 30, 60. |
| 15 Minute MACD Crossed Above Signal (MDAS15) | Signal-line cross up on 15 minute bars, a common day-trade setting. |
| 60 Minute MACD Crossed Above Signal (MDAS60) | Signal-line cross up on 60 minute bars, for longer holds. |
Signal-line crosses come first and come often. They are the early read on a turn.
Zero-line crosses come later and less often. By then the move is usually under way, so traders use them as confirmation more than entry.
Many traders run both: the signal-line cross to get ready, the zero-line cross to confirm the trend.
For bullish crosses, turn on 15 Minute MACD Crossed Above Signal (MDAS15) or the timeframe you trade. Add Relative Volume (RV) at 1.5 or more and a Price range.
Want the cross with the trend? Add Change From 50 Day SMA (%) (MA50P) at a min of 0 so only stocks above their 50-day average come through.
Trade Ideas does not have a MACD divergence alert, and it has no daily MACD alert. What traders do instead is pair the MACD crosses with other readings.
Stochastic alerts like 15 Minute Stochastic Crossed Above 20 (SC20_15) fire when Stochastic leaves oversold. RSI filters like RSI (15 min) (RSI15) show whether the stock is stretched. A MACD cross up while RSI is low and Stochastic is turning up is a combination many traders look for. See the RSI scanner.
Code-based screeners run a MACD rule when you ask, or on a schedule. Trade Ideas streams each cross as it happens across every US stock. You turn on an alert instead of writing a rule.
MACD subtracts a slower moving average of price from a faster one. The standard settings are 12 and 26 periods. The signal line is a 9-period average of MACD. The histogram, on charts that show it, is the gap between MACD and its signal line.
When the fast average pulls away from the slow one, MACD grows. When they come together, it shrinks. Crosses mark the moments those relationships flip.
The same stock can show a bullish cross on 5 minutes and a bearish one on 60 minutes. Neither is wrong; they measure different things.
5 and 10 minute crosses suit scalps and quick day trades. 15 and 30 minute crosses suit most day traders. 60 minute crosses suit traders who hold into the afternoon or overnight.
A common approach is to trade the shorter cross only in the direction of the longer one.
MACD needs bars to calculate. Early in the session, the short timeframes have few bars from today, so readings lean on yesterday's data. Many traders let the first 30 minutes pass before trusting a 5 minute MACD cross.
Cross with the trend. A 15 minute signal-line cross up in a stock above VWAP and above its 50-day average.
Zero-line confirmation. A 60 minute MACD crossing above zero after a pullback, as a sign the pullback is done.
Failed cross. A bullish cross that reverses within two bars, often a sign the move has no buyers.
MACD is built from price only. Add Relative Volume (RV) so the crosses you see come with volume. A cross on a stock trading half its normal volume is easy to ignore.
There is no daily MACD alert. Swing traders often use the 60 minute crosses as a proxy for the daily trend turning, and use daily filters like Change From 50 Day SMA (%) for the bigger picture.
Trend turning up
| Alert or filter | Setting |
|---|---|
| 15 Minute MACD Crossed Above Signal (MDAS15) | On. MACD crosses its signal line on 15 minute bars. |
| 15 Minute MACD Crossed Above Zero (MDAZ15) | On. MACD crosses zero on 15 minute bars. |
| Change From 50 Day SMA (%) (MA50P) | Min 0, above the 50 day. |
| Relative Volume (RV) | Min 1.2. |
Trend turning down
| Alert or filter | Setting |
|---|---|
| 15 Minute MACD Crossed Below Signal (MDBS15) | On. |
| 15 Minute MACD Crossed Below Zero (MDBZ15) | On. |
| Change From 50 Day SMA (%) (MA50P) | Max 0. |
Faster day trade version
| Alert or filter | Setting |
|---|---|
| 5 Minute MACD Crossed Above Signal (MDAS5) | On. |
| Crossed Above VWAP (CAVC) | On, to see VWAP reclaims at the same time. |
| Price (Price) | $5 and up. |
A signal line cross is the early one. It fires when MACD turns, even if it is still below zero. A zero line cross comes later and means the faster average is now above the slower one. Many traders use the signal cross to get ready and the zero cross to confirm the trend changed.
On 5 minute bars, both fire many times a day on active stocks. On 60 minute bars, a cross may be days apart.
Example numbers, not a real trade
Trade Ideas has MACD cross alerts on 5, 10, 15, 30 and 60 minute bars. There is no alert for MACD divergence and no daily MACD alert. For daily trend, the moving average filters do the job.
The MACD histogram is the gap between MACD and its signal line. When the bars grow, momentum is building. When they shrink toward zero, momentum is fading, and a signal line cross is close. A signal cross is the moment the histogram flips from negative to positive or back. Trade Ideas alerts on that flip; the histogram itself is something you read on the chart.
MACD with volume
| Alert or filter | Setting |
|---|---|
| 15 Minute MACD Crossed Above Signal (MDAS15) | On. |
| Relative Volume (RV) | Min 2. |
| Volume (15 min) (Vol15) | Set a floor, such as 50,000 shares in the last 15 minutes. |
| Distance From VWAP 1 (VWAP) | Min 0, so price is above VWAP. |
In the first half hour, 5 minute MACD crosses are mostly noise from the opening swings. Many traders use the Time Of Day (Time) filter with a min of 30 to skip them.
MACD lags price. On a fast stock, the cross can come after much of the move.
Short timeframes cross back and forth in choppy markets. Use 15 minutes or more, or add volume.
Test your rules in a simulated account first.
Free account, just an email. No card. 15-minute delayed data.
Plain answers to what traders search for.
A scanner that finds stocks where MACD just crossed its signal line or zero. Trade Ideas streams 20 MACD alerts across every US stock.
5, 10, 15, 30 and 60 minute charts. There is no daily MACD alert.
No built-in divergence alert. Traders pair MACD crosses with Stochastic alerts and RSI filters instead.
MACD crossing zero means the faster moving average crossed the slower one. It comes later than a signal-line cross.
Sometimes. MACD lags, and crosses fail in choppy markets. Backtest your setup before trading it.
You can try it with a free account, just an email, no card. Free data is 15-minute delayed. Real-time data starts with TI Standard.
Many traders use the standard 12, 26, 9 on 5 or 15 minute charts.
Yes. Put an RSI filter on the same alert window as the MACD crosses.
Past results, including backtests, don't guarantee future results.
Free account, just an email. No card. 15-minute delayed data. Ready to buy? See plans & pricing